Overview
When you’re a web host, whether hosting sites for yourself or your organisation, there’s often times a lot to do to ensure high uptime — especially behind the scenes. Whether that’s monitoring server health, managing extensions, system notifications, traffic and disk usage or SSL certificates, there really is a lot to keep on top of. Today, we work through managing these specific tasks in Plesk 12.
Prerequisite Knowledge
- Some previous experience with server administration, including SSL certificates,
- Some previous experience with Plesk
Introduction

In today’s post, I’m going to get you on top of all these tasks, taking you through how to manage them in Plesk 12. I can’t guarantee you’ll be a legendary systems administrator by the end, but with a bit of time and focus, you’ll definitely be more conversant. Let’s get underway.
System Usage

One thing which can easily run out of control is how the system is used, whether that’s memory, swap, or hard disk space. Sometimes application’s can be poorly designed or written without proper consideration for performance in mind, leading to heavy system load. This can result in a number of things occurring which put strain on the server, which commonly include the following:
- Disk Thrashing: Search servers may continuously poll filesystems for search results or may need to create temporary tables to compute the result of database searches
- Sustained CPU Load: Applications may perform a large amount of calculations or require servers, such as MySQL or PostgreSQL to do so to compute database search results
- High Disk Space Usage: The application may be configured to use the filesystem for caching, and then cache a large amount of application data. For example, an e-commerce site may cache login, search, purchase and account information for 100s — 1000s of users
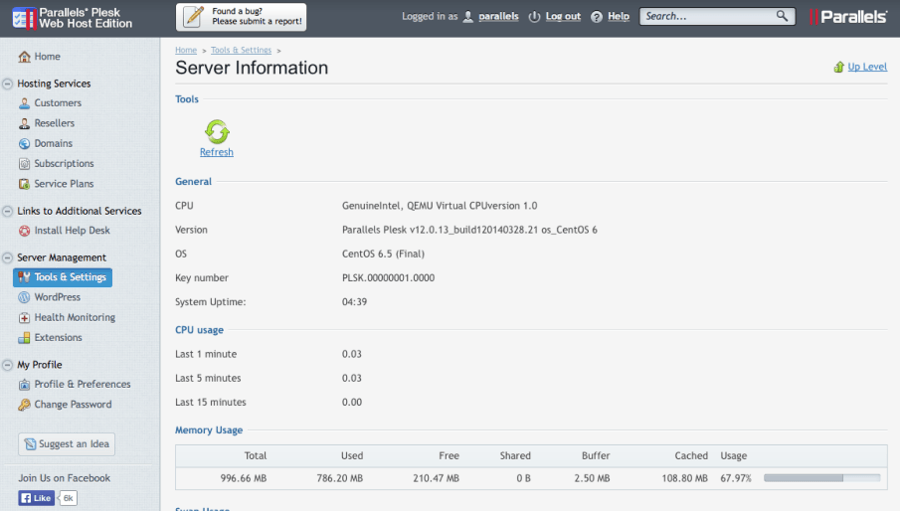
So it’s important to keep abreast of these areas, ensuring that they’re not exceeding a set of predefined usage limits. In the screenshot above, you can see server usage statistics in Plesk 12. To navigate to this page, click Tools & Settings in the lefthand-side navigation tab under Server Management. Initially you’ll see the screen below.

Navigating down, you’ll see sections covering Memory, Swap and Hard Disk usage. For each of these sections, you will see, both graphically and in tabular format, the statistics for each one.
Now that you know where to find this information, it’s handy to know that you don’t need to regularly review it manually. In the next section, we’ll step through how to setup email notifications, should a reseller or customer exceed their account limits.
System Notifications

As there’s so many things to keep abreast of, when administering a server, it’s easier to receive a notification, such as by email, when an event has occurred. What’s more, a number of tasks can be long running, such as provisioning a new website or installing an application.
So waiting around whilst these complete isn’t a particularly effective use of your time. What’s more, you may not be the only person needing to know this information. It may be timely and proactive for your customers and resellers to know as well. That way, they can take action when needed, without you needing to take time out to notify them.
In Plesk 12, email notifications are able to be setup based on a number of pre-defined system events. These include such things as reseller and customer account creation, subscription expiry and exceeding a usage limit. You can see an example of the interface for managing these in the screenshot above.
Setting Up a Notification
Let’s step through enabling an email notification for an administrator when site is created. From the administration page, click the checkbox in the Administrator column for Site creation. In the text field under Email address, click the checkbox next to it and add in your admin’s email address, as in the screenshot below.

Optionally, click the notepad icon in the Text column at the end. Doing so allows for viewing and changing the message contained in the email which will be sent. You can see the default in the screenshot below.

Monitoring Server Health

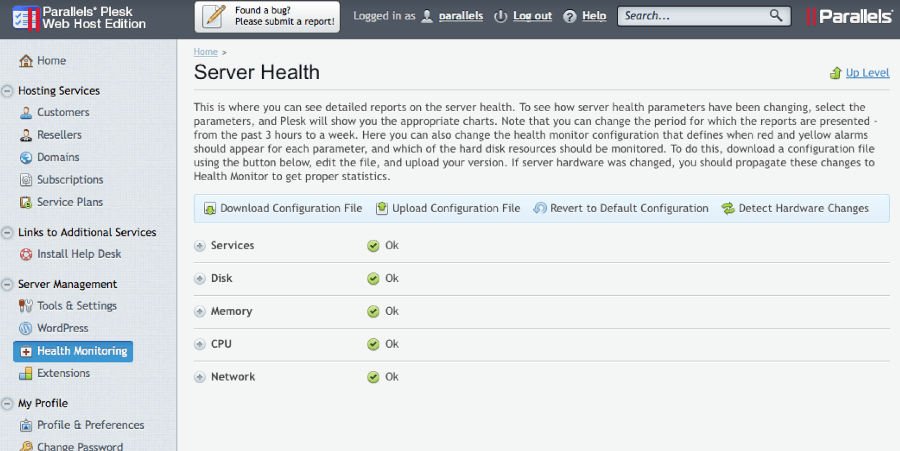
Ok, let’s see how to find snapshots of our system’s health for the running services. In the screenshot above, you can see the default Server Health interface, which displays a concise summary of the state of services, disk, memory, CPU and network usage. This quickly shows us everything’s ok. But if something was wrong, we’d see that as well.
This is great if you just need to get a quick, birds-eye, view. But normally you’d need to go further than that, inspecting the various sections sub-sections; such as services including Apache, Nginx, MySQL and Plesk. So let’s step through how to find that information.
Clicking on any of the top-level services expands it to display its respective sub-components, displaying a snapshot at that level. Clicking on one or more of the specific components displays a graph showing its usage over time, as in the Apache Memory Usage example below.

Here, we can see memory usage, in bytes, for the previous 24 hours, averaging around 19mb. We could also have inspected usage for the previous:
- 3, 6 and 12 hours
- 3 days and previous week
There are a number of other components, and we don’t have time to list them here. But I’ve provided a summary, showing the component and sub-components.
| Component | Sub-Component |
|---|---|
| Services | Apache / Nginx / Mail server/ Plesk CPU & memory usage |
| Disk | Partition “/” utilisation and” data transfer |
| Memory | Real memory usage / Swap usage / Swapping throughput |
| CPU | Total usage / Load average / Processes / Running, Blocked, Paging, Sleeping, Stopped and Zombie processes |
| Network | Interface throughput |
Managing Extensions

If you’re not familiar with them, extensions are a way of extending the functionality of Plesk for specific purposes. Available from Parallels and third party developers, extensions such as the Firewall, Watchdog and File Server allow administrators to go beyond the out-of-the-box feature set. Five are provided by Parallels, these being:
- Counter-Strike game server: to deploy Counter Strike game servers.
- File Server: to share directories on a network directly from Plesk.
- Firewall: to protect the Plesk server and private networks from unauthorised access.
- Watchdog: for system monitoring.
- VPN: for establishing communications between geographically distributed LAN segments over public networks
To maintain extensions, click Extensions in the right-hand side navigation bar, under Server Management. There you’ll see Extensions Management screen, as in the screenshot above. From here, you can add and remove extensions, browse through the extensions catalog, and configure existing extensions.

Clicking on the second extension in our list, Virtual Private Networking, you see that we’re able to set a number of options, including remote address, UDP port and peer address as well as local UDP port and peer address. This was a particularly simple extension, especially when compared with the Watchdog extension.
So depending on the complexity and functionality offered, the options available will vary. But, each configuration screen in each extension, follows the Plesk UI conventions; so they likely quite straight-forward to learn.
Wrapping Up
And that’s a wrap for the initial look at staying on top of server management with Plesk 12. Whilst not an exhaustive walk-through, we were still able cover a number of key features, from extensions and system notifications, to SSL certificates and system usage.
I hope that you now feel much more comfortable and conversant with the Plesk 12 interface for keeping your websites up and running smoothly, with only a minimum of downtime. If there’s anything I’ve missed, or that you felt I glossed over, tell me in the comments. Alternatively, if you’d like to know more, get in touch with us anytime.


