Overview
Plesk Health Monitor provides you with both reporting and alerting on the resource usage of your Plesk based VPS. This allows you to not only ensure that your VPS us running at optimum levels but also preempt issues before the occur. If you are experiencing issues with page load times or slow database queries, the information from Plesk Health Monitor can be invaluable in narrowing down the problem.
Installation
- Login to your Plesk based VPS as the admin user.

- Under Tools and Settings, select Upgrades and Updates on the right hand side. This will open a new browser window.
- Click Add and Remove Components and select the Heath monitor option to enable it.

- Click Continue.
- This will start the install process.
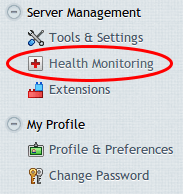
- Once the install is complete, login to Plesk again and on the left hand side you’ll now see Health monitoring on the left hand side:

- You’ll now see a page with a summary of your VPS resources, hopefully with all green ticks!

- As you expand each of the resources, you will see a summary of the underlying services or resource allocations, for example here’s what the Services area looks like:

This will give an instant breakdown of the current resource usage and help you to find any issues. - If you click on any of the tick boxes, you will see a graph of the resource usage. This graph can show a summary of the last 3 hours all the way through to the last week. Here’s an example for Apache CPU usage:

- The system will also alert you via email when there are resource usage issues. This can be invaluable to alert you to issues before they start to become an issue, especially if you’re running an eCommerce platform and don’t want to miss any orders through your site!
If you are finding that your server is using a high amount of resources, Conetix can (in most cases) instantly provide your VPS with a temporary increase. We can also help to diagnose any issues with your configuration which may be causing the resource spike so please feel free to call or submit a support request.
